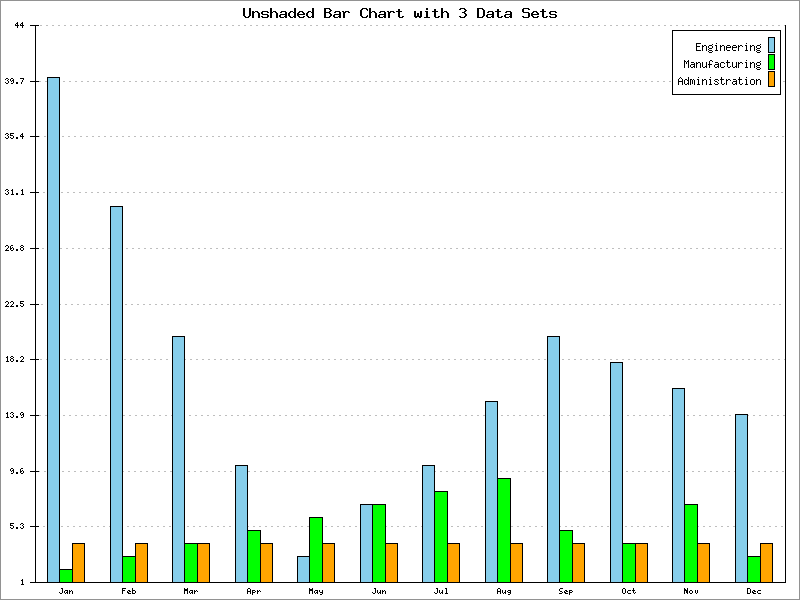
This is the same example as Example 5.4, “Bar Chart” except shading has been turned off. Instead we get flat rectangles with borders for the bars.
Example 5.5. Bar Chart - Unshaded
<?php
# PHPlot Example: Bar chart, 3 data sets, unshaded
require_once 'phplot.php';

$data = array(
  array('Jan', 40, 2, 4), array('Feb', 30, 3, 4), array('Mar', 20, 4, 4),
  array('Apr', 10, 5, 4), array('May',  3, 6, 4), array('Jun',  7, 7, 4),
  array('Jul', 10, 8, 4), array('Aug', 15, 9, 4), array('Sep', 20, 5, 4),
  array('Oct', 18, 4, 4), array('Nov', 16, 7, 4), array('Dec', 14, 3, 4),
);

$plot = new PHPlot(800, 600);
$plot->SetImageBorderType('plain');

$plot->SetPlotType('bars');
$plot->SetDataType('text-data');
$plot->SetDataValues($data);

# Main plot title:
$plot->SetTitle('Unshaded Bar Chart with 3 Data Sets');

# No 3-D shading of the bars:
$plot->SetShading(0);

# Make a legend for the 3 data sets plotted:
$plot->SetLegend(array('Engineering', 'Manufacturing', 'Administration'));

# Turn off X tick labels and ticks because they don't apply here:
$plot->SetXTickLabelPos('none');
$plot->SetXTickPos('none');

$plot->DrawGraph();