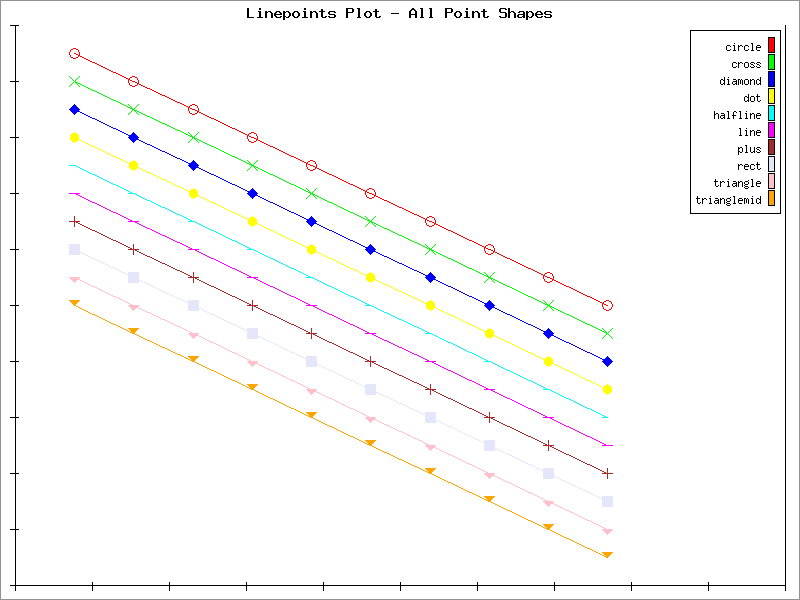
This is a 'linepoints' plot (Lines/Points) showing all the point shapes available for 'point' and 'linepoints' plots. In this example, we also use a legend to display a text string for each data set, and change the data colors to get 10 distinctive colors.
Example 5.7. Line/Point Plot, Point Shapes
<?php
# PHPlot Example: Line-Point plot showing all the point shapes
require_once 'phplot.php';

# This array is used for both the point shapes and legend:
$shapes = array( 'circle', 'cross', 'diamond', 'dot',
    'halfline', 'line', 'plus', 'rect', 'triangle', 'trianglemid');

# Make 10 offset lines, one for each shape:
$data = array();
for ($i = 1; $i <= 10; $i++) {
  $subdata = array('', $i);
  for ($j = 0; $j < 10; $j++) $subdata[] = 20 - $j - $i;
  $data[] = $subdata;
}

$plot = new PHPlot(800, 600);
$plot->SetImageBorderType('plain');

$plot->SetPlotType('linepoints');
$plot->SetDataType('data-data');
$plot->SetDataValues($data);

# Main plot title:
$plot->SetTitle('Linepoints Plot - All Point Shapes');

# Increase X range to make room for the legend.
$plot->SetPlotAreaWorld(0, 0, 13, 20);
# Turn off tick labels - not used for this plot.
$plot->SetXTickLabelPos('none');
$plot->SetYTickLabelPos('none');

# Need 10 different colors;
$plot->SetDataColors(array('red', 'green', 'blue', 'yellow', 'cyan',
                        'magenta', 'brown', 'lavender', 'pink', 'orange'));

# Show all 10 shapes:
$plot->SetPointShapes($shapes);

# Make the points bigger so we can see them:
$plot->SetPointSizes(10);

# Make the lines all be solid:
$plot->SetLineStyles('solid');

# Also show that as the legend:
$plot->SetLegend($shapes);

# Draw no grids:
$plot->SetDrawXGrid(False);
$plot->SetDrawYGrid(False);

$plot->DrawGraph();