We will start with a simple line graph.
<?php
//Include the code
require_once 'phplot.php';
//Define the object
$plot = new PHPlot();
//Define some data
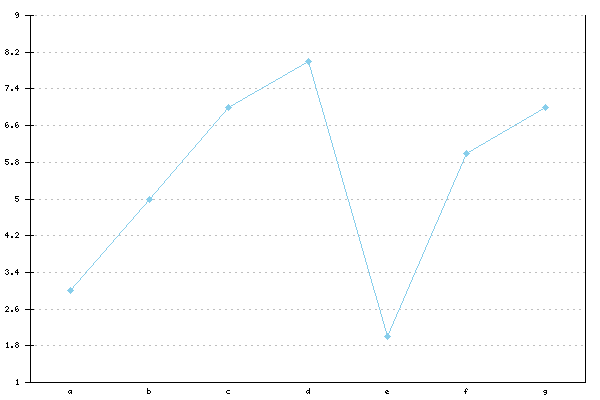
$example_data = array(
array('a',3),
array('b',5),
array('c',7),
array('d',8),
array('e',2),
array('f',6),
array('g',7)
);
$plot->SetDataValues($example_data);
//Turn off X axis ticks and labels because they get in the way:
$plot->SetXTickLabelPos('none');
$plot->SetXTickPos('none');
//Draw it
$plot->DrawGraph();
And that's it! What we get is the following graph:
That's a great start, but now we would like to specify the width and height of the image, and add some titles.